Here is a quick pivot table tip.
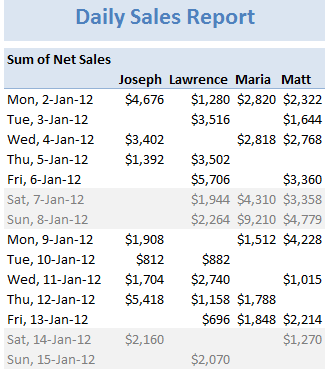
When reporting summaries by month, it would be better to highlight 3 months at a time (Jan, Feb, Mar in one color, Apr, May, Jun in another color) than showing all in one color. Today, lets learn how to do this in easiest possible way.

Highlight Quarters (3 months at a time) using Pivot Table Styles
 We can use pivot table styles for this. Just follow below steps:
- Select the pivot table which you want to format
- Go to Design tab & select a pivot table style you want.
- Right click on the style and choose Duplicate
- Select “First Row Stripe” from modify screen. Enter stripe size as 3.
- Repeat this step for Second row stripe too.
- Click ok.
- IMPORTANT 1: Apply this new style to your pivot report.
- IMPORTANT 2: Check the banded rows option from Design tab.
More on this tip: Customize banded rows / columns in tables
Note: This approach works only when your months start on Jan (or other quarter starts like April, July or October) and days start on Monday. Most business data is like that anyway.
Bonus tip: Generate monthly report from daily data
You can use group dates feature in Pivot reports to generate monthly (or quarterly, yearly) reports from daily data. Learn how to do this.Do you use Pivot table styles?
Formatting a pivot report is often painful. That is where styles can help us. Once you define the correct styles, your pivot reports will look professional and neat. So go ahead and try them. Share your feedback, tips using comments.More on Pivot Tables
Along with formulas, Pivot tables are best friends of Excel analysts. They can take massive amounts of data, process and summarize in just a few clicks. To learn more about them, use below resources.- Tutorial: Introduction to Excel Pivot Tables
- Resource: Pivot tables – examples, tips & information
- Case study: Analyzing non-performing customers using pivot tables
- Feature: Using slicers to setup quick dynamic dashboards
- Training: Join Excel School & become a kick-ass analyst


0 comments:
Post a Comment